Showcases
An oversight of showcases with this technique

Dynamics of cerebral blood volume with ultrasound contrast-enhanced MRI measurements
Dynamics of cerebral blood volume with ultrasound contrast-enhanced MRI measurements
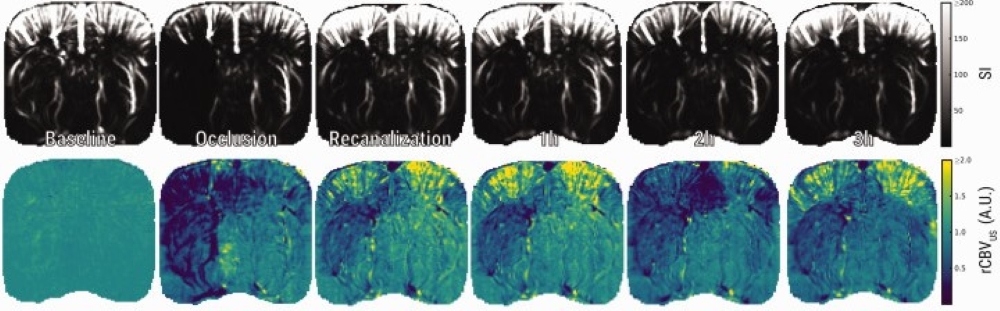
Ultrafast ultrasound (fUS) and dynamic susceptibility contrast-enhanced MRI (DSC-MRI) offer powerful, non-invasive tools to track cerebral blood volume (CBV) dynamics in experimental stroke. Here, these two modalities are used to explore hemodynamic changes before, during, and after middle cerebral artery occlusion (MCAO) in rats. With ultrasensitive Doppler and ultrafast localization microscopy, fUS captures CBV and flow velocity (CBFv) in real time, while DSC-MRI provides a well-established benchmark for perfusion imaging. Both techniques reveal a transient hyperperfusion after recanalization, followed by incomplete CBV recovery and gradual decline in the lesion zone. Notably, discrepancies during occlusion highlight the unique signal properties and processing algorithms of each method. By combining fUS and DSC-MRI, researchers gain complementary, whole-brain insights into post-stroke hemodynamics, advancing preclinical stroke research.
Fig. Ultrasensitive Doppler shows loss and subsequent incomplete restoration of CBV after tMCAO. (a) Representative images of raw ultrasensitive Doppler signal and relative CBV (rCBVUS) over the course of an experiment.Ultrasensitive Doppler shows loss and subsequent incomplete restoration of CBV after tMCAO. (a) Representative images of raw ultrasensitive Doppler signal and relative CBV (rCBVUS) over the course of an experiment.

Imaging Drug Delivery with SPECT and DCE-MRI
Imaging Drug Delivery with SPECT and DCE-MRI
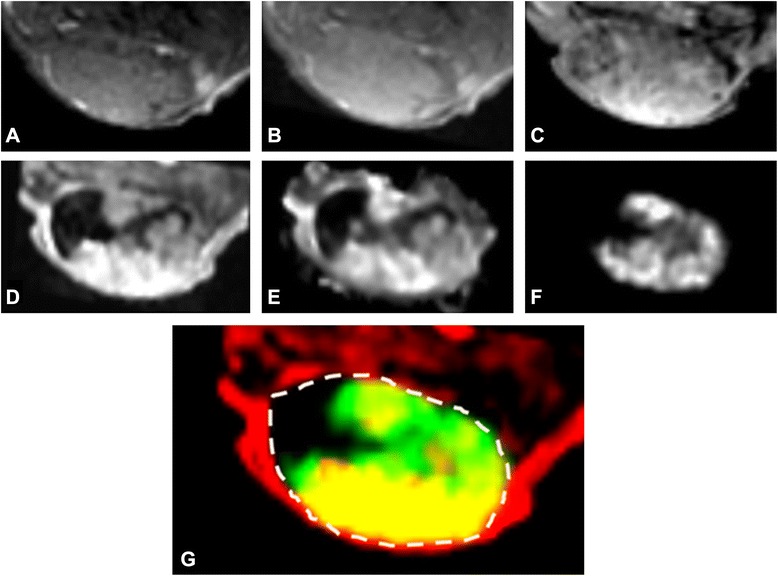
The combination of SPECT and MRI can unveil vital insights into the perfusion efficiency and the accumulation of radiolabeled receptor-targeting peptides in solid tumors. This multimodal approach reveals nuanced variations in functional tumor characteristics, even in seemingly homogeneous tissue. By leveraging DCE-MRI-derived parameters, it is possible to decode tumor perfusion, vessel density, and permeability, unlocking insights into the impact of vascular traits on the efficacy of receptor-targeting therapies.
Fig. Example of MRI and SPECT images and DCE-MRI parameters of a single tumor slice. a T1-weighted MRI. b T2-weighted MRI. c T2*-weightedMRI. d Area under the curve for the first 60 s (AUC60). e Ktrans. f SPECT radiopeptide uptake. g Overlap (yellow) between AUC60 (red) and SPECT (green)within the tumor boundary (dotted line).

Optical Imaging of Tumor Response
Optical Imaging of Tumor Response
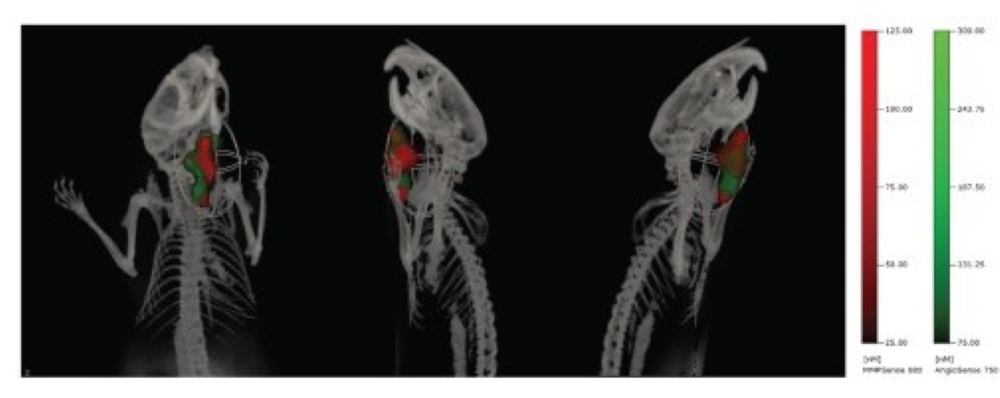
Optical imaging offers a non-invasive way to monitor processes involved in tumor growth and metastasis formation in immunodeficient mice. Here, fluorescence molecular tomography (FMT), with advanced 3D imaging, is used to delve deeper into the effects of hyperbaric oxygen therapy (HBOT) and radiation on tumor dynamics. By analyzing blood vessels with AngioSense and unraveling hypoxia with HypoxiSense probes, FMT provides a comprehensive view of the tumor environment. Seamlessly integrating FMT with CT imaging provides precise anatomical references. In this way, optical imaging methods can provide longitudinal insights into tumor properties, revolutionizing oncology research.
Fig. Effect of HBOT on tumor vasculature. Multimodal FMT/CT imaging of a FaDu-luc mouse 24 h after injection of MMPSense680 (red) and AngioSense750 (green) to detect tumor margins and region of tumor vascular leak, respectively.

Quintuple Modality Tumor Necrosis Imaging
Quintuple Modality Tumor Necrosis Imaging
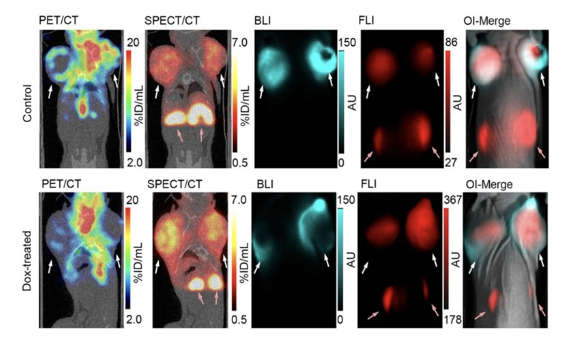
Harness the power of both nuclear and optical imaging to accurately identify therapy-induced tumor necrosis. This multimodal approach provides complementary insights into tumor response. PET with FDG accurately monitors tumor metabolism and serves as a benchmark for treatment effectiveness. While SPECT and fluorescence imaging (FLI), equipped with an advanced necrosis-binding contrast agent, precisely reveal areas of necrosis by exploiting damaged membrane integrity, enabling cell death to be visualized. In addition, bioluminescence imaging (BLI) detects viable tumor cells. Together, this comprehensive suite of imaging techniques provides essential insights that lead to tailored treatment strategies.In vivo detection of therapy-induced tumor necrosis.
Fig. Representative four-modality imaging on non-treated (Control) or doxorubicin-treated (Dox-treated) MCF7-Luc2 tumor-bearing mice. Representative coronal [18F]FDG-PET/CT and [111In]3-SPECT/CT images, followed by bioluminescence (BLI) and fluorescence (FLI) images and an overlay of the two optical imaging modalities (OI-Merge). The white arrows indicate locations of tumors and the red arrows indicate locations of kidneys.
